aeciopires/docker-hub-image-statistics
A tool for display statistics about Docker images published on Docker Hub
71
aeciopires/docker-hub-image-statistics repository overview
Docker Hub Image Statistics
Know how your Docker images are really being used. Docker Hub shows a single number, the total pull count. This image turns it into pulls in the last collection, last 24 hours, 7 days, 30 days and hour by hour, for every public image of your user or organization. You get them in a self-hosted web UI, a JSON API, Prometheus metrics and Grafana dashboards.
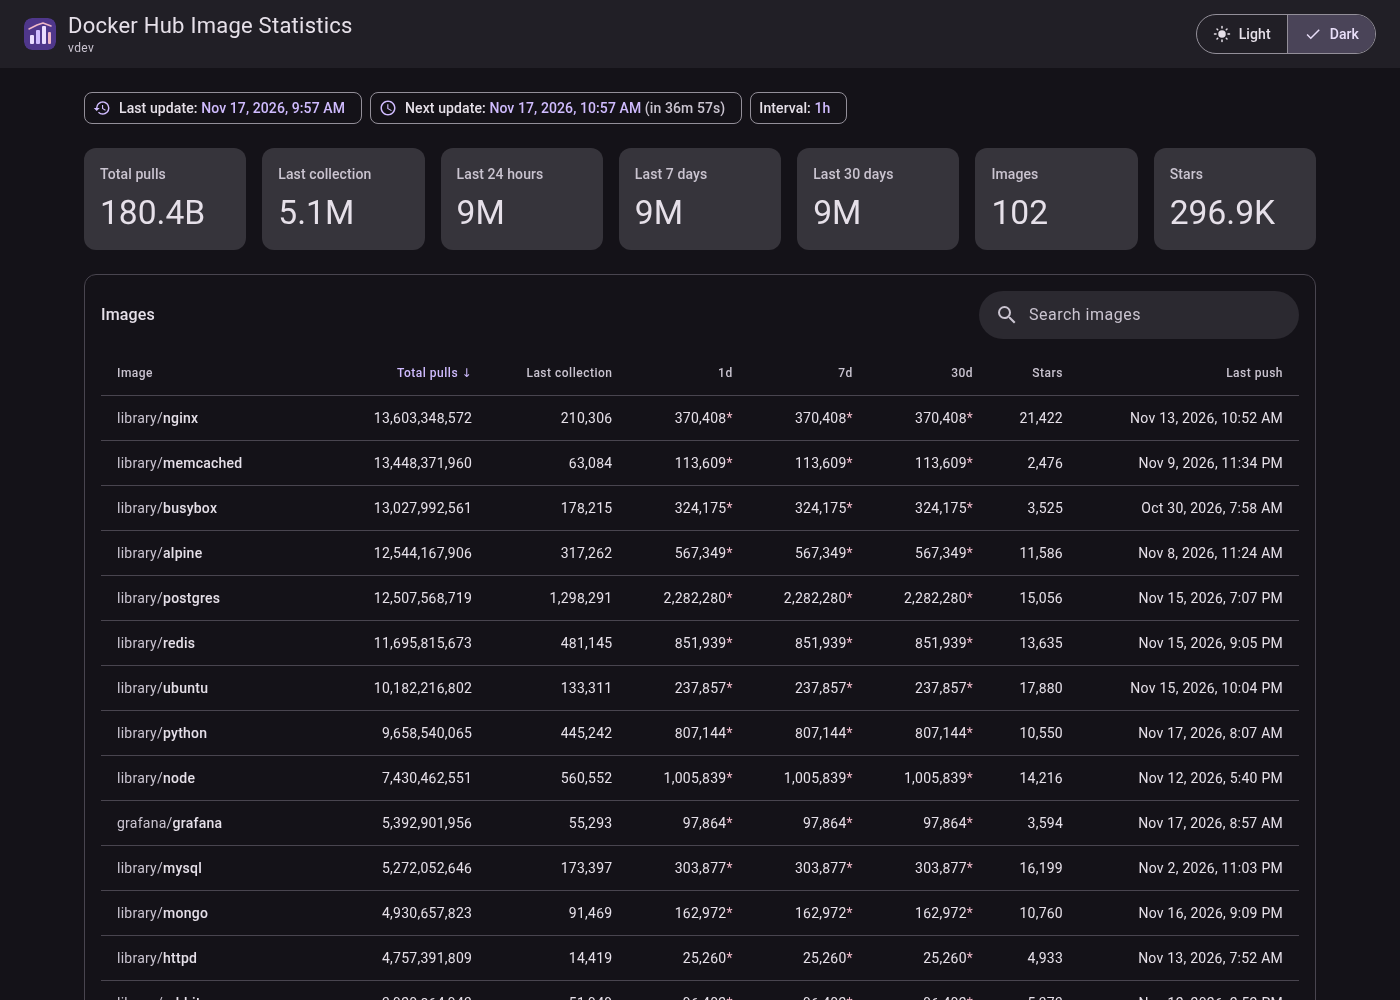
- Docker Hub Image Statistics
Quick reference
| Source code | https://github.com/aeciopires/docker-hub-image-statistics |
| Documentation | https://github.com/aeciopires/docker-hub-image-statistics/tree/main/docs |
| Issues | https://github.com/aeciopires/docker-hub-image-statistics/issues |
| Architectures | linux/amd64, linux/arm64 |
| Port | 8080 (web UI, API, /metrics, health checks) |
| Volume | /data (history: SQLite + JSON) |
| User | 65532 (non-root), distroless base, about 27 MB |
docker pull aeciopires/docker-hub-image-statistics:latest
Why
Docker Hub only keeps a cumulative counter, so it cannot answer simple questions such as "how many pulls did my image get this week?", "what happened in the last hour?" or "did the last release increase adoption?".
This application works like a meter reader: every hour (configurable) it writes down the counter of each image, keeps the history and subtracts the readings to get the pulls of each period.
Features
- Automatic discovery of every public image of users or organizations,
plus explicit images (
nginx,grafana/grafana, ...), with include/exclude globs. - Pull statistics per image and in total:
- total;
- last collection (between the two newest readings);
- last 24 hours, 7 days and 30 days;
- an hourly chart and table.
- Configurable schedule (every hour by default) with last update and next update shown live in the UI. Restarts keep the schedule, so no API calls are wasted.
- Friendly with Docker Hub rate limits:
- client-side pacing;
- pauses when the quota is low;
- retries that honor
Retry-After; - an optional personal access token for higher limits.
- History cached in SQLite, on disk and in memory, with automatic fallback.
- Configuration: YAML file,
DHIS_*environment variables and command-line flags, with built-in defaults. Reload onSIGHUPwithout restarting; invalid files are rejected. - Material Design 3 web UI, dark mode by default with a light/dark switch, searchable and sortable table. Fully self-contained: no CDN, no external fonts, works offline.
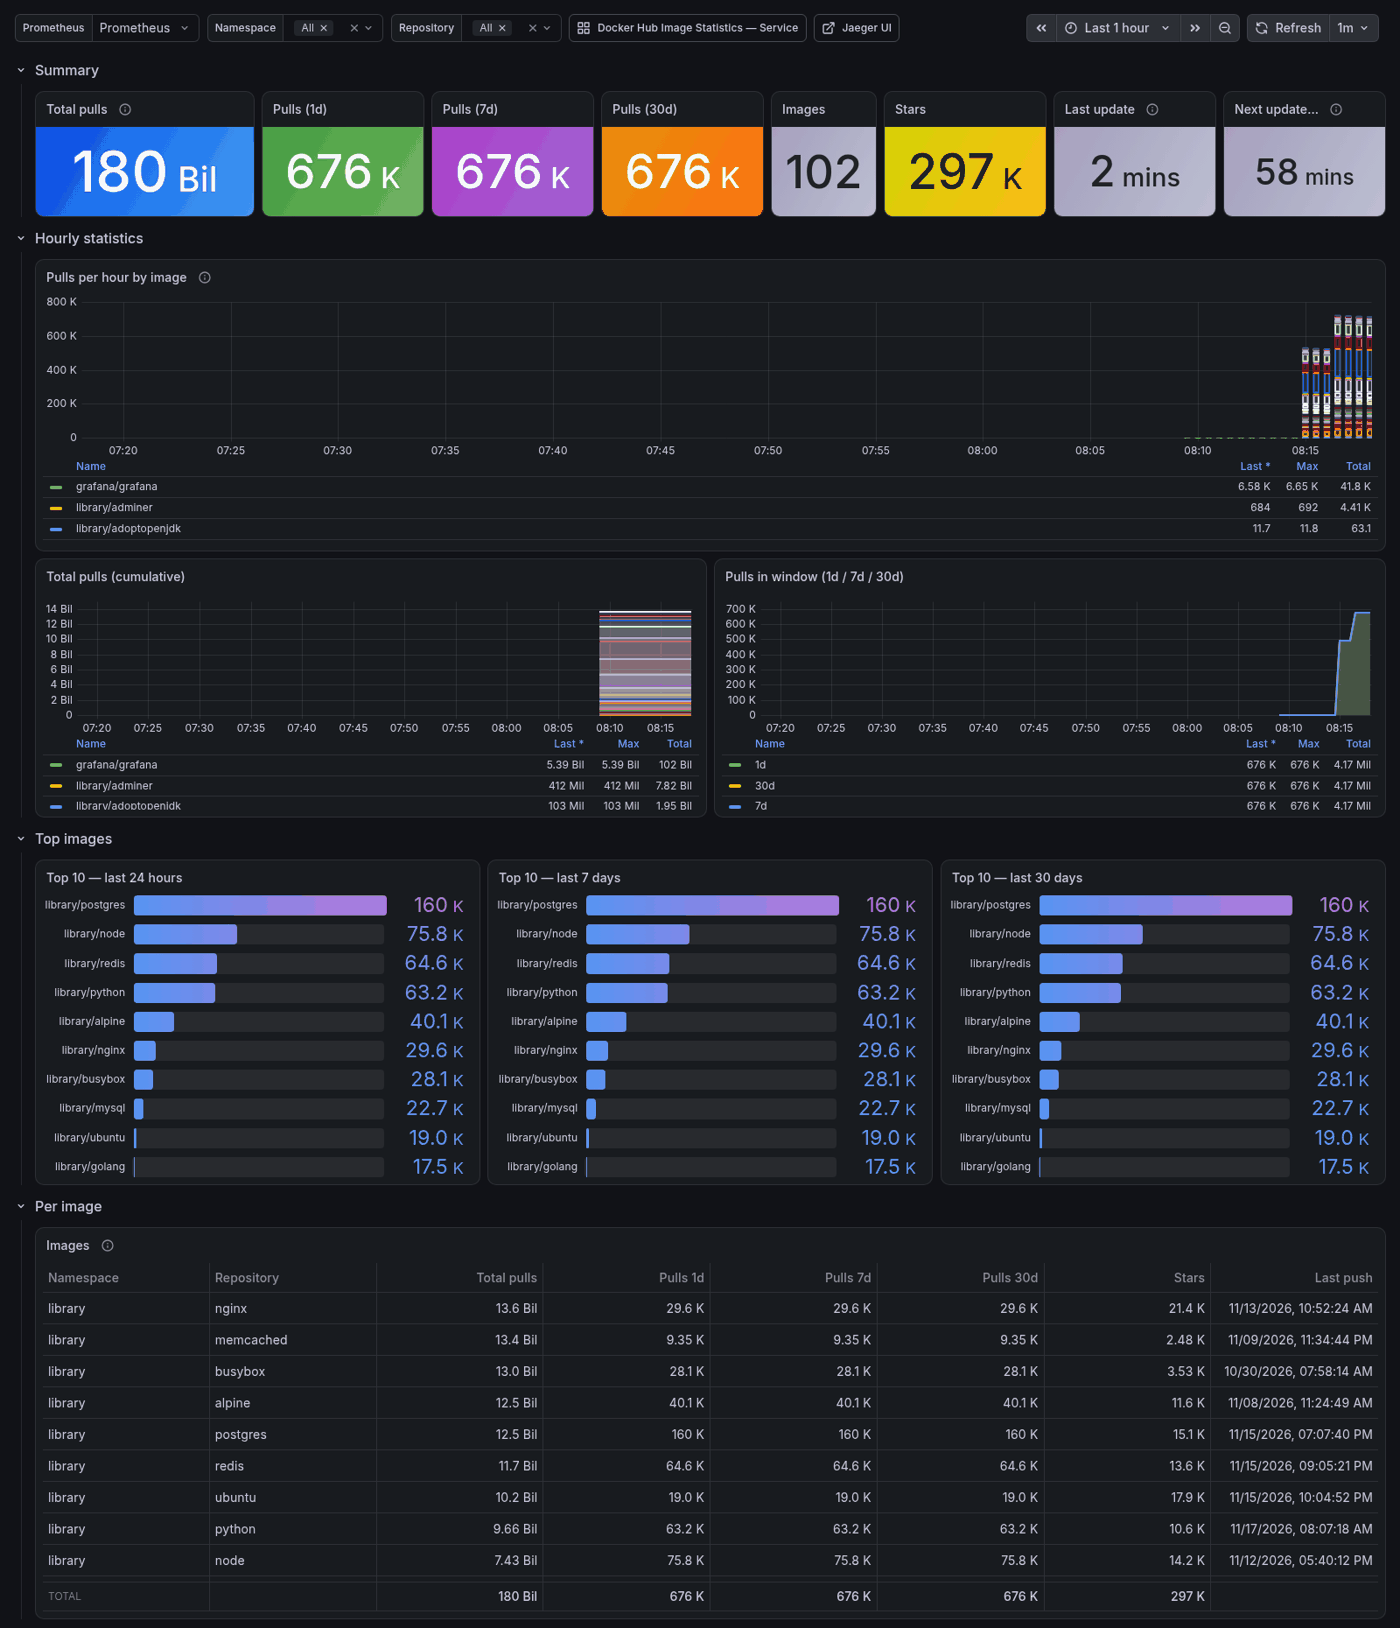
- JSON API, Prometheus metrics, OpenTelemetry traces and logs, and
JSON logs with levels (default
INFO). Two Grafana dashboards are available. - Health checks (
/healthz,/readyz) and a built-inhealthcheckcommand, since the image has no shell or curl.
How to use this image
Run it in one minute
Track your organization (replace myorg) plus a few official images:
docker run -d --name dhis -p 8080:8080 \
  --read-only --cap-drop ALL --security-opt no-new-privileges \
  -v dhis-data:/data \
  -e DHIS_DOCKERHUB_NAMESPACES=myorg \
  -e DHIS_DOCKERHUB_REPOSITORIES=nginx,redis \
  aeciopires/docker-hub-image-statistics:latest
Open http://localhost:8080. The first collection runs right away. The
"last collection", 24h, 7d and 30d numbers fill in as the history grows, so
keep the /data volume.
Check it from the command line
curl -s http://localhost:8080/api/v1/summary
curl -s 'http://localhost:8080/api/v1/images?sort=last'
curl -s http://localhost:8080/metrics | grep dockerhub_image_pulls
docker exec dhis docker-hub-image-statistics config   # effective config (add -c FILE when using a file)
Use a configuration file
Mount a directory, not a single file. Editors replace files when saving, and a single-file bind mount keeps showing the old content.
mkdir -p config && cat > config/config.yaml <<'EOF'
dockerhub:
  namespaces: [myorg]
  repositories: [nginx, grafana/grafana]
  exclude: ["*/*-dev"]
collector:
  interval: 1h
log:
  level: info
EOF

docker run -d --name dhis -p 8080:8080 \
  --read-only --cap-drop ALL --security-opt no-new-privileges \
  -v dhis-data:/data -v "$PWD/config:/etc/dhis:ro" \
  aeciopires/docker-hub-image-statistics:latest serve --config /etc/dhis/config.yaml
Every option is described in the configuration guide.
Reload the configuration without restarting
Edit config/config.yaml, then:
docker kill --signal HUP dhis
docker logs dhis | tail -2   # "configuration reloaded" or "configuration reload rejected"
An invalid file is rejected and the running configuration is kept.
Command-line flags
POSIX-style short and long flags; flags override environment variables, which override the file:
docker run --rm aeciopires/docker-hub-image-statistics --help
docker run --rm aeciopires/docker-hub-image-statistics --version
docker run -d -p 8080:8080 -v dhis-data:/data aeciopires/docker-hub-image-statistics \
  -n myorg,otherorg -r nginx -i 30m -l debug
| Short | Long | Meaning |
|---|---|---|
-c | --config | YAML configuration file |
-n | --namespaces | Users/organizations to discover |
-r | --repositories | Explicit images |
-i | --interval | Collection interval (30m, 1h, 1d) |
-l | --log-level | debug, info, warn, error |
-a | --address | Listen address (default :8080) |
-h | --help | Help (on every command) |
-v | --version | Version |
Commands: serve (default), config, healthcheck, version, completion.
Docker Compose
services:
  dhis:
    image: aeciopires/docker-hub-image-statistics:latest
    command: ["serve", "--config", "/etc/dhis/config.yaml"]
    ports: ["127.0.0.1:8080:8080"]
    environment:
      DHIS_DOCKERHUB_USERNAME: ${DHIS_DOCKERHUB_USERNAME:-}
      DHIS_DOCKERHUB_TOKEN: ${DHIS_DOCKERHUB_TOKEN:-}
    volumes:
      - ./config:/etc/dhis:ro
      - dhis-data:/data
    read_only: true
    cap_drop: [ALL]
    security_opt: ["no-new-privileges:true"]
    restart: unless-stopped
volumes:
  dhis-data:
Reload after editing the file: docker compose kill -s SIGHUP dhis.
Environment variables
Every YAML key has a variable: DHIS_ + the key in upper case with . → _.
The most used ones:
| Variable | Default | What it does |
|---|---|---|
DHIS_DOCKERHUB_NAMESPACES | library | Users/organizations to discover (none clears the list) |
DHIS_DOCKERHUB_REPOSITORIES | empty | Extra images (ns/name or name) |
DHIS_DOCKERHUB_USERNAME / DHIS_DOCKERHUB_TOKEN | anonymous | Personal access token: higher API limits and more than 100 repositories per namespace |
DHIS_COLLECTOR_INTERVAL | 1h | How often to collect (minimum 5m anonymous, 1m authenticated) |
DHIS_CACHE_RETENTION | 2160h | History kept (90d also works) |
DHIS_LOG_LEVEL | info | debug, info, warn, error |
DHIS_LOG_FORMAT | json | json or text |
DHIS_TELEMETRY_OTLP_ENDPOINT | empty | OTLP/HTTP endpoint, e.g. http://otel-collector:4318 |
DHIS_TELEMETRY_TRACES / DHIS_TELEMETRY_LOGS | false | Export traces / logs over OTLP |
DHIS_CONFIG_FILE | empty | Configuration file (same as --config) |
Anonymous clients are limited by Docker Hub to 180 API calls per minute per IP and see only the first 100 repositories of a namespace. The application stays within those limits automatically.
Ports, volumes and health check
| Item | Value |
|---|---|
| Port | 8080/tcp |
| Volume | /data: SQLite database and JSON copy of the history |
HEALTHCHECK | built in: docker-hub-image-statistics healthcheck (every 30s) |
| Read-only root filesystem | supported (only /data is written) |
Endpoints
| Path | Description |
|---|---|
/ | Web UI |
/api/v1/images, /api/v1/images/{ns}/{name}, .../history?range=24h&step=1h | JSON API |
/api/v1/summary, /api/v1/status, /api/v1/version | Totals, collector status, build info |
/metrics | Prometheus metrics (dockerhub_image_pulls_total, dockerhub_image_pulls{window}, dockerhub_image_pulls_last_collection, ...) |
/healthz, /readyz | Liveness and readiness |
Go further
Full observability stack
Clone the repository to start the application together with the newest OpenTelemetry Collector, Prometheus, Loki, Tempo, Jaeger and Grafana. They come already wired, with the dashboards provisioned:
git clone https://github.com/aeciopires/docker-hub-image-statistics.git
cd docker-hub-image-statistics
make stack-up
Grafana: http://localhost:3000 · Prometheus: http://localhost:9090 · Jaeger: http://localhost:16686.
Kubernetes with Helm 4
git clone https://github.com/aeciopires/docker-hub-image-statistics.git
helm upgrade --install dhis docker-hub-image-statistics/charts/docker-hub-image-statistics \
  -n dhis --create-namespace --set 'config.dockerhub.namespaces={myorg}'
helm test dhis -n dhis
The chart includes:
- restricted Pod Security defaults and a NetworkPolicy;
- liveness and readiness probes;
- Ingress, or Gateway API
HTTPRoute; extraObjectsfor any extra manifest;- a
ServiceMonitorand the Grafana dashboards.
Details are in the chart README.
Image details and security
- Base
gcr.io/distroless/static-debian13:nonroot, pinned by digest: no shell, no package manager. - Static Go binary (Go 1.27,
CGO_ENABLED=0, pure-Go SQLite), runs as UID 65532. - Works with
--read-only,--cap-drop ALLandno-new-privileges. - Strict Content-Security-Policy: the UI never loads anything from the Internet.
- Image, repository and Helm chart are scanned with Trivy.
Developer
- Aecio Pires - https://linktree/aeciopires
License
GPL-3.0. The embedded Roboto font is licensed under the SIL Open Font License 1.1.
Contribute
Issues and pull requests are welcome. Read the contributing guide, and give the project a ⭐ on GitHub if it helps you.
Tag summary
Content type
Image
Digest
sha256:0e99c840d…
Size
10.1 MB
Last updated
about 17 hours ago
docker pull aeciopires/docker-hub-image-statistics